
Overview
SFS Contours is an application designed to assist a mission analyst in visualizing the variations of performance requirements and certain spatial relations over a span of departure and arrival dates of heliocentric trajectories between two solar system bodies. This is achieved by drawing lines of constant values (contours) of one or more of 16 trajectory variables over a departure date/arrival date grid. Because of the characteristic shape of energy related parameters, such as hyperbolic excess speed, such contours are often called “porkchop plots”.
SFS Contours is a new product, first introduced in January 2026. It is intended for use by mission and trajectory design analysts as a tool that complements any suite of mission design software.
SFS Contours is required for each workstation on which it is installed and may be used by all users with an account on that workstation. Licenses are perpetual and include version upgrades that are released within six months of purchase. Contact SpaceFlightSolutions for current licensing fees for the application.
™SFS Contours is a trademark of Jerry L. Horsewood
Features
- Supports all phases of the contour charting process:
- Create data file from which mapping of contours is performed
- Create sorted lists of data points used to draw contours segments and draw segments
- Label contours with parameter value, show line legend, and save or print drawing
- Contour line color and style selectable for each parameter
- Default contour label and legend positions can be changed by dragging or keyboard arrows
- Grid width and height and number of major and minor subdivisions may be customized
- Custom annotations and drawing title may be added with complete font control
- Data file and sorted lists saved to permit future re-drawing of contours
- Completed drawings may be sent to printer or saved as .jpg, .png, or .gif bitmaps
- Drawing may also be saved in script file that may be reloaded in application in its original form, including line labels, legend and custom labels and is editable.
The User Interface
The graphical user interface (GUI) for the contours application includes a main menu bar, a control panel and the drawing area with a grid background. Following is an example showing contours of departure and arrival hyperbolic excess speeds, in km/s, for the 2033 Earth Mars mission opportunity.

Note that the control panel has three tabs down the right side, of which the lower tab is active in the figure. The controls on this tab allow one to customize the size and configuration of the grid area and to toggle the legend and line label displays. Additional controls permit one to add or edit custom text annotations and the chart title, while the controls at the bottom of the panel permit one to save or print the drawing. The contents of the other two tabs are shown below.

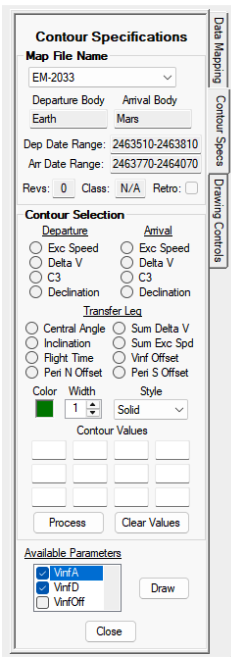
The panel on the left provides controls for creating a file of trajectory solutions over ranges of departure and arrival date ranges at a specified time increment. The content that populates the panel above is that used to create the data file from which the contour chart above was drawn. Once the file is created, it is saved and re-used for later drawings. The panel on the right is used to process specific parameters to create sorted lists of grid points defining the contours of a parameter of interest. The option buttons are used to select any one of 16 parameters to be processed. Desired values of the parameter for which controus are to be created are entered in the data field under the label “Contour Values”. Once processed the list of points defining the contour are saved and may be used without re-processing for future drawings. Descriptive names of the parameters that have been processed are listed in the scrollable list under the heading “Available Parameters”. Drawings are made of all parameters in the list for which its checkbox is checked.
Utilities and Support Tools
Identifying the appropriate date ranges for displaying contour charts are not necessarily obvious. Several tools are included with the applications to help identify ranges of interest and are accessed from the main menu bar.
- From Ephemerides, one can interrogate the ephemeris files of solar system objects
- From DB Editors, one can add Spice Kernel files for objects of interest
- From Tools, one can access applications that identify dates of alignment of two bodies and dates where nodal transfers occur
- From Resources, one can learn how to acquire new epemeris files.
Visualization Support
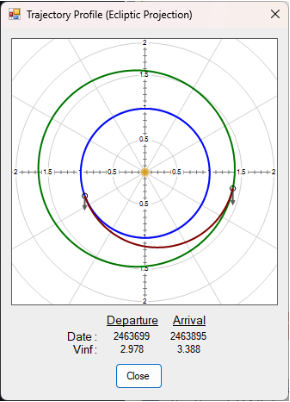
When viewing a drawing of contours, the actual trajectory that would result for a specific departure date/arrival date pair may not be immediately obvious. To clarify this issue, one can point the cursor to any point in the grid and right-click the mouse to display a new form that shows the trajectory along with the dates and hyperbolic excess speeds at departure and arrival. An example for a point within the union of the Type 1 3 km/s departure excess speed contour and the 3.5 km/s arrival excess speed contour is shown in the figure on the right. Less obvious trajectory profiles occur for transfers where the flight time and travel angle are at opposite extremes. Some examples are shown below.
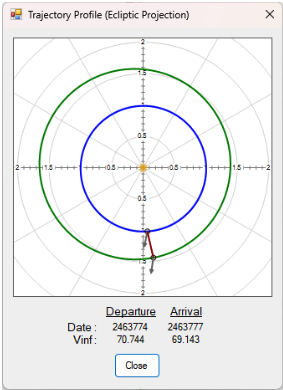
3-day flight time, 2-degree travel angle

3-day fight time, 358-degree travel angle
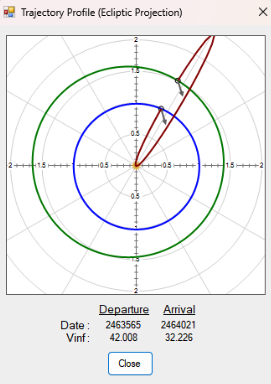
356-day flight time, 358-degree travel angle
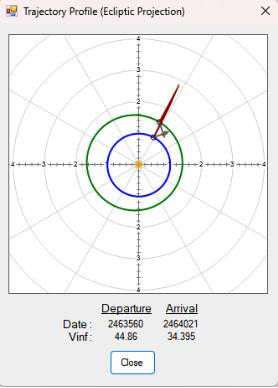
461-day flight time, 2-degree travel angle
Documentation
Documentation for the SFS Contours application is provided in a variety of forms.
- A Help file is provided for the application. It is accessed with the ‘?’ button located next to the Close button on the title bar of the form. Clicking this button results in the display of a Word document explaining the purpose and use of the form.
- Additional information is provided at the button labeled ‘Quick Tips’ located at the right end of the main menu bar. Its purpose is to alert the user to features on the form that are not visible.
- Additional documents are available at Resources on the menu bar.
- Tooltip balloons are provided for each control on the form to describe the purpose of the control.
System Requirements
SFS Contours is a 64-bit Windows Forms application running on the Windows 11 platform. It is licensed for use by all user accounts on a single workstation. For successful operation, the application requires that the workstation also host the Word application of Microsoft Office. Acceptable performance of SFS Contours is achieved with virtually any current laptop or desktop computer that is capable of running the Windows 11 operating system.